The Detriments of Diversity (or Why Diversity Sucks)
Posted by alex in crime, Diversity, diversity is hate, studies at 9:48 pm |  Permanent Link
By Robert Ericsson
I. Introduction
In 2005, a group called the “Beyond Diversity Resource Center” (www.beyonddiversity.org) released a study which ranked all 50 states in terms of their “diversity”. Using data from the U.S. Census Bureau for the year 2000, the study assigned a numerical score to each state. This number was intended to quantify the probability of “encountering a person of a different race”. The study was intended as a guide to the individual in understanding the opportunities and degree of effort required to incorporate the “richness” and “value” of diversity into one’s life. The “Beyond Diversity Resource Center”(hereafter BDRC) is founded on the ridiculous assumption that “diversity” is somehow beneficial to all races, Whites included. This bias is demonstrated in the rankings assigned to the 50 states with #1 being most diverse and #50 being least diverse. Like most pseudo-intellectual efforts of this kind, the study never attempts to quantify, demonstrate or clearly explain WHY diversity is so beneficial. It is simply taken for granted that diversity is “good”. Despite these underlying flaws, the data are not without merit. In fact, they serve as a useful guide by demonstrating the difficulty of avoiding diversity based on one’s location, and in identifying low-diversity areas which might be appealing destinations for travel or relocation. Furthermore, the study provides a valuable empirical basis for demonstrating just how detrimental diversity really is.
Figure 1 shows the BDRC’s rankings and the diversity score assigned to each state.
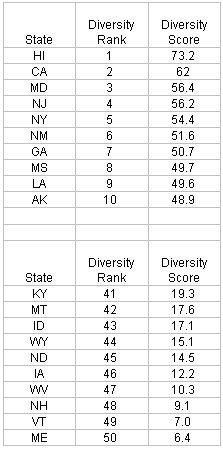
Figure 1. Diversity scores and rankings: Top 10 and bottom 10 states
II. Diversity and Crime
The Federal Bureau of Investigation periodically compiles and publishes a set of data called the “Uniform Crime Reports” (UCR). This data is a comprehensive study of reported crimes in the United States based on information compiled by more than 17,000 law enforcement agencies across the nation following strict methodological guidelines. This data is aggregated into various metrics, including breakdowns of crime by state. Comparing this data with the information compiled by the BDRC begins to address the real value (read detriment) of diversity.
2A: Violent Crime
The most obvious comparison is to examine diversity vs. the overall incidence of violent crime based on the FBI’s number of violent crimes per 100,000 people for each state. This comparison, shown for the most and least diverse states is shown in Figure 2.

Figure 2. Diversity rankings and violent crime: Top 10 and bottom 10 states
As the table clearly shows, the states with the highest amounts of diversity also have high rates of violent crime. The ten most diverse states have a rate of violent crime that is more than double that of the 10 least diverse states. It is in fact 152% higher. Of the top 10 most diverse, only Hawaii ranks among the 10 states with fewest violent crimes. Four of the most diverse states are in the top ten list of states with most violent crimes per 100,000, and all but two are in the top 25. By comparison, the states with low diversity scores also have extremely low rates of violent crime. None of the states with the lowest diversity rankings are among the top 25 in most violent crimes per 100,000 people. In looking further at the data for the 10 “least diverse” states, the highest rate of violent crime among them is in West Virginia with 316.5 violent crimes per 100,000. This makes it 34th in the nation. Of the 10 states with the lowest incidence of violent crime, seven of them are also in the lowest 10 in the diversity rankings which is a literally amazing number. The three states with the fewest violent crimes per 100,000 Vermont, Maine and North Dakota rank 48th, 49th and 45th in terms of their diversity rankings.
Since the BDRC rankings are indicative of the probability a person in a particular state has of encountering a member of another race, the obvious conclusion is therefore that the more likely a person is to encounter a member of another race, the more likely that person is to encounter a violent criminal as well.
Statistics on individual types of violent crimes such as murder, non-negligent manslaughter, forcible rape, and aggravated assault are also available. Examining trends in individual crimes showed similar patterns to the overall rate of violent crime and were therefore excluded
2B: Property Crime
Another logical comparison is to examine the incidence of property crime as it relates to diversity. This data is presented in Figure 3. Trends in property crime show a similar, correlation to the diversity ranking. Again, those states with more diversity experience much higher incidence of per capita property crime. As an aggregate, the 10 most diverse states experience 46% more property crime per 100,000 residents than the least diverse states.

Figure 3. Diversity rankings and property crime: Top 10 and bottom 10 states
Of the 10 most diverse states, three rank among the top 10 in property crimes per 100,000 people, and six rank in the top 25. By contrast, in the 10 least diverse states, ZERO rank among the top 10 in property crimes per 100,000 people and ZERO rank among the top 25. In fact, within the group of 10 states determined to have the least diversity, the highest ranking in property crime per 100,000 people is Montana with 3,292.7. This makes it 30th in the nation. The remaining 9 least diverse states are all in the bottom 20 when it comes to per capita property crimes. The figure also shows that 4 of the 5 states with the least amount of property crime also show up in the group of the least diverse states. They are Maine, West Virginia, New Hampshire and North Dakota which rank 46th, 47th, 48th and 49th respectively in rates of property crime per 100,000 people. So again, the likelihood of encountering a member of another race is highly correlated with the likelihood of being the victim of a property crime.
III. Diversity and Drug Use
The United States Department of Health and Human Services periodically conducts a study called the “National Household Survey on Drug Abuse(NHSDA)”. The information is based on survey questions regarding drug, alcohol and tobacco use. The data covers past month use, past year use, past year dependence or abuse, and is further broken down by state and age group. The following table shows the results of the year 2000 survey for the 10 most and least diverse states. It is based on the percentage of those respondents who reported use of any illicit substance over the course of the month prior to the survey.
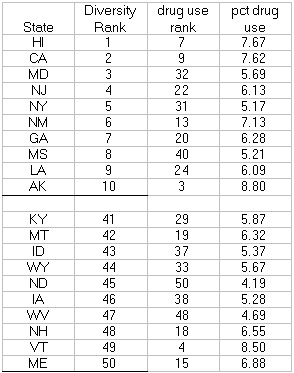
Figure 4. Diversity rankings and drug use: Top 10 and bottom 10 states
There is a surprising degree of overlap in these statistics. Especially noteworthy are the high rankings of the 3 least diverse states New Hampshire, Vermont and Maine which all rank in the top 25 in terms of illicit drug use. With Montana included, 4 of the least diverse states are in the top half of all states in terms of drug use. As for the most diverse states, there is still a strong degree of correlation. Seven of the 10 most diverse states are also in the top half of all states with regard to persons using illegal drugs in the past month. Three of these states are in the top 10. Although there is some degree of correlation between diversity and drug use, this information by itself does not lead to a compelling conclusion regarding this relationship. A more exhaustive study considering all 50 states would be of interest, but is not presented in this article. Note that this study is based on survey information given voluntarily and may not capture the “real” rates of drug use.
IV. Diversity and HIV/AIDS
Crime and drugs are certainly important issues, but there is certainly other data that can be used to estimate the value (i.e. damage) of diversity in a particular area. The Centers for Disease control and prevention track the rate of HIV infection per 100,000 people, and also break the data down by state.

Figure 5. Diversity rankings and HIV infection: Top 10 and bottom 10 states
*Note: The rates of AIDS infection shown here are based on year 2004 data. As noted previously, diversity indices were calculated based on Year 2000 data.
Of the 10 most diverse states, all but one rank in the top 25 in terms of AIDS infection rate. Five of the ten most diverse states are in the top 10 states with the highest rates of AIDS infection. In these highly diverse states, the lowest rate of AIDS infection is 6.70 in Arkansas, which places it 30th in the nation in terms of AIDS infection rate. In fact, EVERY ONE of the 10 least diverse states has a rate of AIDS infection that is lower than every one of the most diverse states. The rate of AIDS infection in the most diverse states is almost SIX TIMES as high as the rate on infection in the least diverse states. This striking evidence shows a clear correlation between the probability of encountering a member of another race and the probability of encountering a person infected with AIDS.
V. Other Criteria
This study also examined other indicators of the potential value and costs of diversity. The data did not show striking differences between the most diverse and least diverse states in these areas and are mentioned only for completeness.
5A: Income
Statistics on household income were considered, but showed no striking statistical correlation when compared against the BDRC data. Higher diversity states such as New Jersey and Maryland were among the highest in average household income, whereas other high diversity states such as Arkansas and Mississippi were among the lowest. Similarly, low diversity states like New Hampshire(especially) and Vermont had high household incomes, while Kentucky, West Virginia and Montana were among the lowest in that category.
5B: Education/Literacy
Information such as school assessment was likewise considered, but showed overlap similar to those in income. Furthermore, the standard deviations were minuscule and provided only minimal value for cross-state comparisons. Statistics on adult literacy were available, but the predominance of persons speaking English as a second language in border states naturally creates a geographical skew in this area.
VI. Conclusions
This article has examined a number of factors as they relate to “diversity” in particular states. The most striking statistics are in the area of criminal activity. This data shows a strong correlation between crime and diversity in terms of both violent and property crimes. It is clearly evident that areas with more diversity also have higher rates of crime, and there can be little doubt about the causality of this relationship. Rates of HIV infection are vastly higher in more diverse areas, and there is some evidence to indicate that drug use is potentially higher. None of the criteria considered demonstrated any particular “value” in having diversity. A study which can show strong empirical evidence demonstrating that there is value in diversity would be of interest. Until that time, it seems like the sooner we can get “beyond diversity” and restore White society, the better off we’ll be.
Sources:
-Diversity scores and rankings taken from The Beyond Diversity Resource Center www.beyonddiversity.org
-Statistics on Violent and Property Crime are from the FBI Uniform Crime Reports 2000
-Drug use information taken from U.S. Dept. of Health and Human Services Office of Applied Studies, State Estimates of Substance Use from the 2000 National Household Survey on Drug Abuse
– AIDS/HIV data from Centers for Disease Control and Prevention
-Income data from the U.S. Census Bureau
27 September, 2006 at 10:16 pm
I would say that these charts only show a partial picture. As we all know those who wish to push diversity also have no qualms about playing with crime stats and school stats. Attempted murder is reduced to assault, rape is reduced to sexual assault and on and on. Lately there was a story about the false reporting of school records in black school systems such as in Camden, NJ, further proving the point. Of course this is all done to protect the stupid white masses from learning the truth, and the poor little blacks and browns from feeling bad.
27 September, 2006 at 11:34 pm
SSSOOOO AAAHHHH Your saying that if i want to smoke some crack, rob a house and get fucked in the ass I don’t need to go to Bangkok but NJ? Is that right?
28 September, 2006 at 6:42 am
BTW, AIDS is a fraud. The more trembling, liberal idots that get tested, the more “AIDS cases” there’ll be. The states with the lowest “AIDS stats” are those with the fewest trembling, liberal idiots, and/or “public health” programs.
28 September, 2006 at 7:01 am
to Jackumup; or You can go someplace around NE Washington DC between 7 and 20 streets and UP from Kstreet LOL
and dont forget “rasta” hair due and Smith&Wesson or you just will get killed …
28 September, 2006 at 8:41 am
Jackumup – you seem tense. Perhaps you should go to a website where you might feel more at home – http://www.onlydudes.com. Enjoy.
28 September, 2006 at 2:08 pm
You boys sure have a lot of knowlege about that stuff
28 September, 2006 at 10:09 pm
For those considering moving out of California or New York, I\’d pick those lowest on the diversity index.
Thanks for taking the time to crunch the numbers.
29 September, 2006 at 1:00 am
“For those considering moving out of California or New York, I’d pick those lowest on the diversity index.”
Yes Geoff, and fortunately, the whitest states also are the ones that have the highest respect for the 2nd Amendment. There is a direct correlation in nearly every category of concern: the higher the excrement colored diversity, the fewer the rights and the higher the crime.
One nice thing for us is that California is kind of like the old canary in the coal mine. It will self destruct first, giving us some time to gauge what ZOG’s response is and also give us a notice as to the time remaining before total civilizational meltdown.
27 November, 2006 at 7:27 pm
I agree. It was said in the article that no one ever said why diversity was important. Well, this is what I think. Diversity is important because it causes us to increase our boundaries, to look beyond who we are and to experience new things. Say, for example, that I met an immingrant at my work that was from Denmark. I was chatting with them right before Thanksgiving, and they said that they weren’t going to spend the day with anyone, since they haven’t ever celebrated Thanksgiving before. I invite them over, they learn tons about good old American culture, and it gives me and my family something interesting to talk about, learning about the holidays exclusive to Denmark.
See, when we meet people who are different, we learn. If we are in a community where there is no diversity, we put a cap on the amount of knowledge that we will ever be able to gain, and that level is actually pretty low. So, if you would like to stay ignorant for the rest of your life, never knowing true happiness because you have nothing to compare it to, I say, It’s your own damn life. Do what you want, but don’t discriminate at other people’s choices. I won’t stop you, but I will tell you my opinion.
I wish I could ask for respect in return, but I seriously doubt that anyone full of this much hate has any compassion.
12 December, 2006 at 1:05 pm
Maryland-
Have you never attended school? Do you never open a book? Have you never travelled? These things open minds and educate. To say that people are ignorant if they don’t have dinner with foreigners is an ignorant, simple-minded statement. Dinner with a true Dane could be a good experience, but should you dine with a Kenyan you might find yourself spellbound with their stories of clitorectomies performed on young girls. Chow with a Chinese and you’ll be charmed at their quaint custom of dumping baby girls in the wilderness to die of exposure or be eaten by an animal. Familiarity could breed contempt. Wise up!